Network troubleshooting is the systematic process of identifying and resolving connectivity and performance failures using a structured, layer-based diagnostic method. Knowing how to troubleshoot networks separates engineers who resolve incidents in minutes from those who spend hours guessing. The OSI model’s seven layers provide the foundational framework every network administrator needs. Approximately 80% of network connectivity problems originate in OSI layers 1–3. That single fact tells you where to spend most of your diagnostic time.
What are the key preparatory steps before troubleshooting a network?
Two questions define the entire scope of any network incident before you run a single command. The first is “What changed?” and the second is “Does this affect everyone or just one user?” Answering both narrows the problem from “the network is broken” to a specific device, segment, or configuration change. A site-wide outage after a firmware push points to a different root cause than one user losing DNS resolution on a Tuesday morning.
Once you have defined the scope, assemble your diagnostic toolkit before touching any configuration. The standard set includes:
- ping and tracert (or traceroute on Linux) for basic reachability and path testing
- nslookup and dig for DNS resolution checks
- ipconfig (Windows) or ip addr (Linux) for interface and IP address verification
- tcpdump and Wireshark for packet-level capture and analysis
- netstat or ss for active connection and socket state inspection
- A physical cable tester for Layer 1 verification
- Baseline command outputs from a known-good state
That last item is the one most engineers skip. Maintaining a “known-good” baseline snapshot of outputs like ss -s or netstat -s on healthy hosts gives you an immediate comparison point during an outage. Without it, you are guessing what “normal” looks like.
Pro Tip: Document every configuration change in a shared log with a timestamp and the engineer’s name. When an incident hits, the change log is the first place to look.
How to troubleshoot networks using the OSI model layer by layer
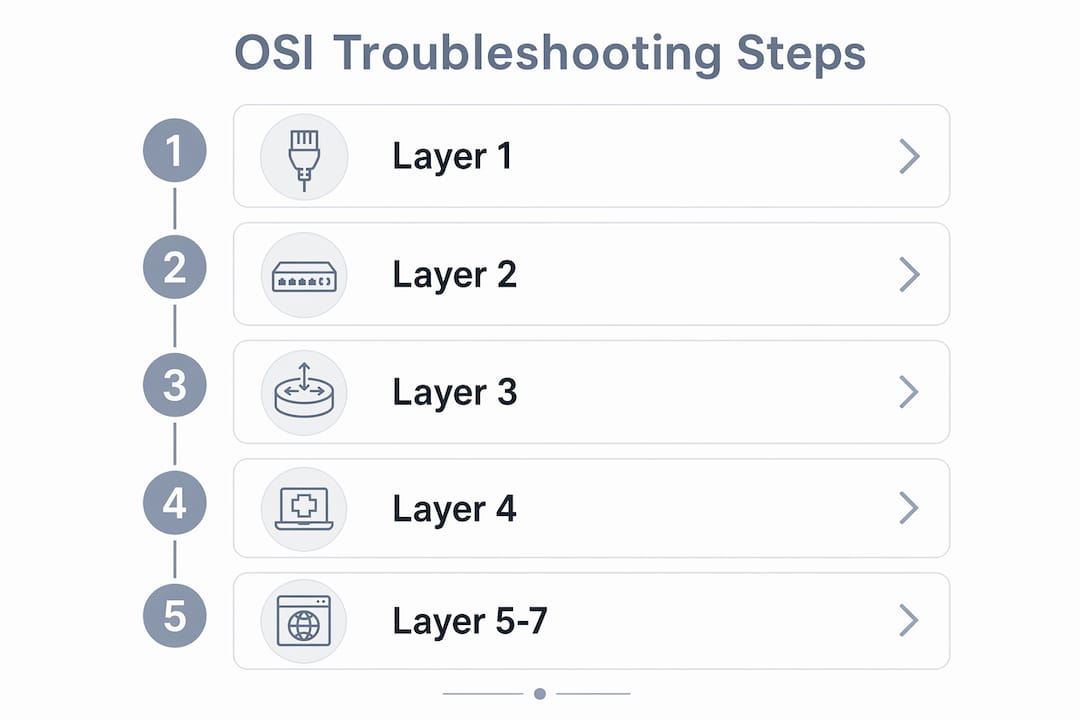
A linear, stepwise walk through OSI layers is the most effective diagnostic method. Skipping layers wastes time and introduces guesswork. Start at Layer 1 and work up. The table below maps each layer to its key checks, common failures, and the tools that expose them.
| OSI Layer | Key checks | Common failures | Tools |
|---|---|---|---|
| Layer 1 – Physical | Cable integrity, link lights, port status | Damaged cables, bad SFP, CRC errors | Cable tester, show interfaces |
| Layer 2 – Data Link | MAC table, VLAN assignment, duplex settings | VLAN mismatch, duplex mismatch, STP loop | show mac address-table, show spanning-tree |
| Layer 3 – Network | IP addressing, routing table, default gateway | Wrong subnet, missing route, ACL block | ping, traceroute, show ip route |
| Layer 4 – Transport | Port reachability, firewall rules, session state | Firewall blocking TCP/UDP, port exhaustion | netstat, ss, telnet <host> <port> |
| Layer 7 – Application | Service response, DNS resolution, TLS handshake | DNS failure, certificate error, app misconfiguration | nslookup, curl, browser dev tools |
Layer 1: physical inspection first
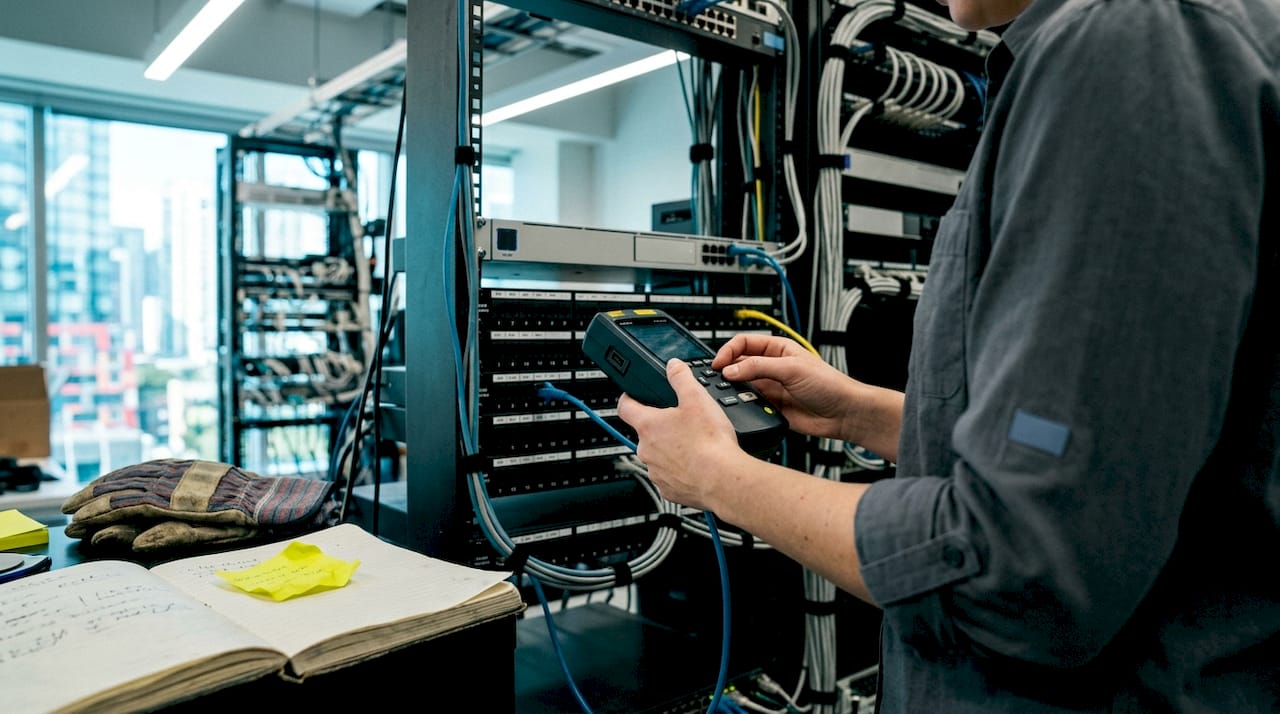
Check cable integrity and link lights before anything else. A CRC error rate as low as 0.01% on a 10GbE link causes measurable TCP throughput degradation. That means a cable that “looks fine” can silently cripple performance. Replace suspect cables or SFP modules before pursuing any software diagnosis.
Layer 3: confirming reachability
At Layer 3, ping confirms basic IP reachability and traceroute reveals where packets stop. A traceroute that dies at hop three inside your own network points to a routing or ACL problem, not a server issue. Always test from multiple points: the affected client, the default gateway, and a known-good host on the same VLAN.
Layer 4: transport and firewall checks
Use netstat -an or ss -tnp to see which ports are listening and which connections are established. A service that is running but not accepting connections on its expected port usually means a firewall rule or a misconfigured bind address. Test port reachability directly with telnet <host> <port> or nc before blaming the application.
Pro Tip: Resist the urge to jump straight to Layer 7 when users report “the app is down.” A broken application is often a broken Layer 3 route or a Layer 4 firewall rule in disguise.
What advanced troubleshooting techniques improve network diagnostics?
Basic ping and traceroute confirm reachability. They do not tell you why a connection is slow, why large file transfers fail, or why a session drops every 20 minutes. That is where packet capture with tcpdump or Wireshark becomes the definitive diagnostic tool. Seeing what is actually on the wire removes all guesswork.
When reading a packet capture, focus on these specific indicators:
- TCP RST packets: a remote host is actively rejecting the connection, usually a firewall or a closed port
- ICMP Unreachable messages: a router cannot forward the packet, pointing to a routing or ACL failure
- DNS NXDOMAIN responses: the hostname does not resolve, meaning a DNS misconfiguration or a typo in the application config
- TCP retransmissions: packet loss is occurring somewhere in the path, often a physical layer problem
- Fragmentation or ICMP “Fragmentation Needed” messages: an MTU mismatch is silently breaking large transfers
MTU mismatches deserve special attention. A classic symptom is that small packets (like ping) succeed while large transfers fail or stall. The fix is to verify the MTU setting end-to-end and adjust TCP MSS clamping on the relevant interface.
Network failures follow a handful of repeatable patterns. Building a personal or team pattern library of common fault scenarios, each with its symptoms, capture signatures, and resolution steps, dramatically cuts diagnostic time on repeat incidents. Treat every resolved incident as a case study worth documenting. The network troubleshooting tips that save the most time are the ones you wrote after solving a problem the hard way.
What troubleshooting mistakes should IT professionals avoid?
The most destructive mistake in network troubleshooting is “thrashing.” Skipping the observation phase and making random configuration changes without a clear hypothesis increases resolution time and often creates new problems on top of the original one. Every change you make without a testable reason is a variable you cannot control.
The correct sequence is: observe, form a hypothesis, test one change, measure the result. If the change does not fix the problem, roll it back before trying the next hypothesis. This mirrors the scientific method and keeps the environment stable enough to reason about.
After applying a fix, verification is not optional. Confirm resolution using the same tools you used to detect the problem. If ping was failing, confirm it now succeeds. If a user reported slow file transfers, measure throughput again with a tool like iperf3. User feedback alone is not sufficient. Users often report “it’s working” before a fix has fully propagated or before the underlying issue recurs.
Pro Tip: Set a 30-minute post-fix monitoring window. Watch interface error counters, CPU load on the affected device, and session logs before closing the ticket. Intermittent issues often resurface within that window.
Document the resolution in detail: what the root cause was, what change fixed it, and what the verification steps confirmed. That record becomes the first entry in your pattern library for the next engineer who sees the same symptom.
Key Takeaways
Effective network troubleshooting requires a structured, layer-based approach that begins with defining scope, uses the OSI model as a diagnostic framework, and ends with verified, documented resolution.
| Point | Details |
|---|---|
| Start with two questions | Ask “What changed?” and “Who is affected?” before running any diagnostic command. |
| Focus on layers 1–3 first | 80% of network issues originate in the physical, data link, and network layers. |
| Use packet capture early | tcpdump and Wireshark reveal root causes that ping and traceroute cannot. |
| Avoid thrashing | Make one change at a time with a clear hypothesis; roll back if it does not resolve the issue. |
| Document every resolution | A written record of root cause and fix becomes a pattern library that cuts future MTTR. |
What I’ve learned from years of network troubleshooting in the field
The single biggest efficiency gain I have seen in network troubleshooting is not a better tool. It is patience in the observation phase. Engineers who spend five minutes gathering data before touching a config consistently resolve incidents faster than those who start changing things immediately. The data collection phase feels slow. The random-change phase feels productive. The data collection phase is the one that actually works.
Packet capture is the skill most engineers underinvest in. Jumping to conclusions without capture data extends Mean Time To Resolution even when the engineer is experienced. Wireshark has a learning curve, but the return on that investment is enormous. I have watched a 10-second capture close a ticket that had been open for two days.
Network complexity keeps increasing. VLANs, SD-WAN overlays, cloud-hosted DNS, and containerized applications all add layers of abstraction between a user complaint and its root cause. The engineers who adapt fastest are the ones who treat every incident as a learning opportunity and build their pattern libraries deliberately. The OSI model does not change. The discipline of working through it systematically does not change either. That consistency is what makes troubleshooting a skill rather than a lottery.
— Aaron
Lowvoltagecorp network support for IT professionals
Network problems do not always stay in the software layer. Physical infrastructure, cabling quality, and low voltage systems all affect network performance in ways that command-line tools cannot fully diagnose.

Lowvoltagecorp specializes in the installation, repair, and maintenance of wired and wireless networks, security cameras, motorized gates, and cell boosters. When your troubleshooting points to a physical layer problem you cannot resolve remotely, the wired network troubleshooting steps resource walks through the exact process Lowvoltagecorp uses in the field. For broader low voltage infrastructure issues affecting network performance, the fix low voltage issues fast page covers gates, cameras, and network hardware in one place. Reach out to Lowvoltagecorp directly for on-site diagnostic support across South Florida.
FAQ
What does “how to troubleshoot networks” mean in practice?
Network troubleshooting is the process of systematically diagnosing and resolving connectivity or performance failures using structured tests at each OSI layer. It starts with defining the problem scope and ends with verified resolution and documentation.
Which OSI layers cause most network problems?
80% of network issues originate in layers 1–3, covering physical cabling, data link switching, and IP routing. Start your diagnosis there before moving to transport or application layers.
What is the fastest way to find a network root cause?
Packet capture using tcpdump or Wireshark is the most reliable method for complex issues. It shows exactly what traffic is on the wire, removing guesswork from the diagnostic process.
What is “thrashing” in network troubleshooting?
Thrashing is the practice of making random configuration changes without a clear hypothesis. It extends resolution time and often introduces new problems. Always form a testable hypothesis before making any change.
How do I confirm a network issue is actually resolved?
Use the same diagnostic tools that detected the problem to verify the fix. Measure throughput with iperf3, confirm DNS resolution with nslookup, and monitor interface error counters for at least 30 minutes after the change.