A network diagram is a schematic visual map showing how devices, connections, and systems integrate within a network infrastructure. Every IT professional and network administrator who designs, documents, or troubleshoots systems depends on these diagrams to translate complex environments into clear, readable visuals. Tools like Microsoft Visio, Lucidchart, and Creately are the industry standard for building them. Teams that use clear network visuals gain 20–25% productivity improvements in collaboration-heavy IT environments. That number reflects how much time gets lost when documentation is vague or missing entirely.
What are the main types of network diagrams?
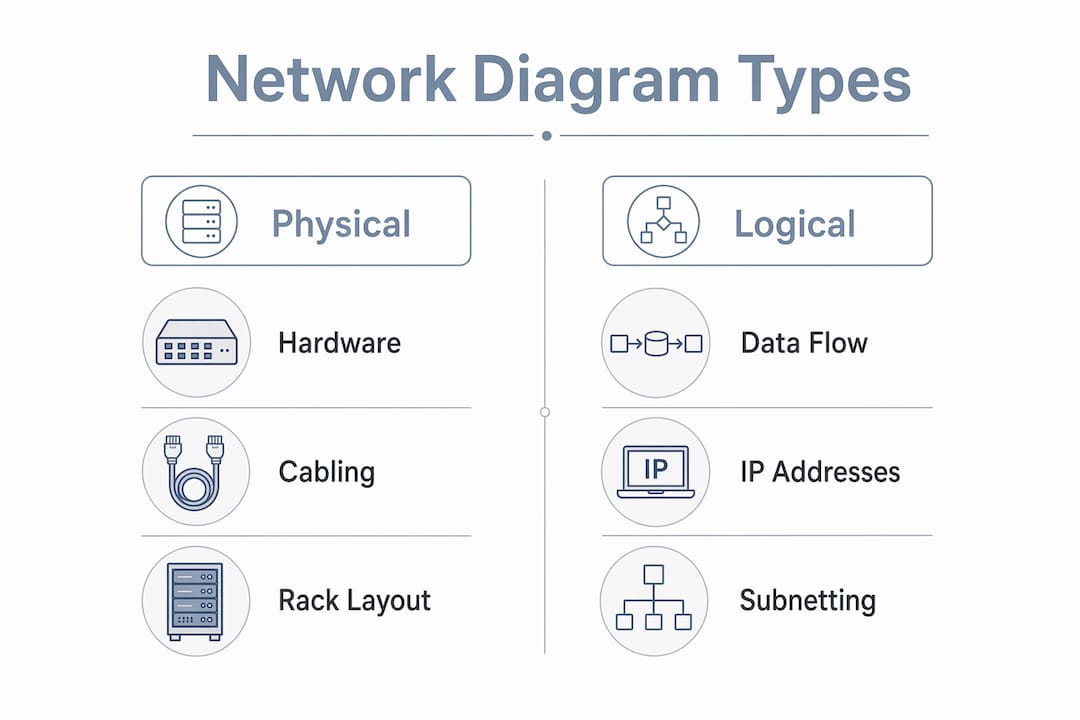
Network diagrams split into two primary categories: physical and logical. Each serves a distinct purpose, and confusing the two is one of the most common mistakes IT teams make.
Physical network diagrams
A physical network diagram maps the tangible hardware in your environment. It shows server rack positions, switch locations, cable runs, port assignments, and physical device placement. This type is your go-to during installation, hardware upgrades, and on-site maintenance. When a technician needs to know which cable connects to which port in which rack, the physical diagram answers that question immediately.

Logical network diagrams
A logical diagram maps data flows rather than physical hardware. It shows IP addressing schemes, subnet boundaries, VLAN assignments, and routing paths between network segments. This type is built for troubleshooting connectivity issues, reviewing security policies, and planning network segmentation. You cannot see a cable on a logical diagram, but you can trace exactly how traffic moves from one segment to another.
Physical vs. logical: a side-by-side comparison
Maintaining both diagram types is a recognized best practice for complete network insight. Here is how they compare across key attributes:
| Attribute | Physical diagram | Logical diagram |
|---|---|---|
| Focus | Hardware placement and cabling | IP addressing and traffic flow |
| Primary use | Installation and maintenance | Troubleshooting and design |
| Key elements | Racks, ports, cables, device locations | VLANs, subnets, routing paths, firewall rules |
| Audience | Field technicians, installers | Network engineers, security teams |
| Update trigger | Hardware changes | Configuration or policy changes |
Both diagram types complement each other. A physical diagram tells you where a device lives. A logical diagram tells you how that device communicates.
Which standard symbols are essential for network diagrams?
Standardized symbols are the universal language of network diagrams. Without them, one engineer’s drawing becomes another engineer’s guessing game. Non-standard icons cause communication errors and troubleshooting delays that cost real time and money.
The most common symbols you will encounter and use include:
- Router: A cylinder or circle with arrows, representing traffic routing between networks
- Switch: A rectangle with multiple arrows, indicating Layer 2 or Layer 3 switching
- Firewall: A brick wall or shield icon, marking security boundaries between segments
- Server: A rack-mounted rectangle or tower, representing compute resources
- Endpoint/workstation: A monitor or laptop icon, showing user devices
- Cloud: A cloud shape representing external networks, the internet, or hosted services
- Access point: A radio wave icon, indicating wireless coverage zones
Line styles carry meaning too. Solid lines denote physical connections; dashed lines indicate logical or backup paths. Arrows show traffic direction. A bidirectional arrow means traffic flows both ways. A single arrow points toward the destination of a one-way flow. Getting these wrong on a diagram creates dangerous assumptions during a live troubleshooting session.
Pro Tip: Always include a legend on every diagram you publish. List every symbol and line style with a plain-language description. A diagram without a legend forces readers to guess, and guessing in a network environment leads to misconfigurations.
How do you create an effective network diagram?
Network diagrams function as architectural blueprints for digital infrastructure. You would not wire a building without a blueprint. The same discipline applies here. Finalizing your diagram before any hardware deployment prevents poor performance and connectivity problems that are expensive to fix after the fact.
Follow this five-step process to build a diagram that actually serves your team:
-
Define scope and purpose. Decide what the diagram covers. Is it a single building floor, a full campus, or a cloud environment? Clarify whether you are building a physical diagram, a logical diagram, or both. Scope creep produces diagrams that confuse rather than clarify.
-
Inventory your components. List every device that belongs in the diagram: routers, switches, firewalls, servers, access points, and endpoints. Include IP addresses, hostnames, and port assignments for logical diagrams. Include physical locations and cable types for physical diagrams.
-
Select your topology. Choose the network topology that reflects your actual or planned design. Common options include star (all devices connect to a central switch), mesh (devices interconnect directly for redundancy), bus (devices share a single communication line), and ring (devices connect in a closed loop). Most enterprise networks use a hierarchical star topology with core, distribution, and access layers.
-
Place core devices first. Start with your highest-tier devices: core routers and firewalls at the top, distribution switches in the middle, access switches and endpoints at the bottom. This top-down layout mirrors how traffic actually flows and makes the diagram intuitive to read.
-
Map connections with standard symbols. Draw connections using the standardized five-step method and apply correct line styles. Label every link with relevant details: interface names, IP addresses, VLAN IDs, or bandwidth capacity.
Pro Tip: Treat your network diagram exactly like an architectural blueprint. No contractor pours a foundation before the architect finalizes the plans. Lock down your diagram before you rack a single device.
Tools like Microsoft Visio, Lucidchart, and Creately all support drag-and-drop symbol libraries with pre-built network icons. Creately and Lucidchart both offer cloud-based collaboration, which matters when your team is distributed across sites.
How do you interpret and use network diagrams for troubleshooting?
Network diagrams transform complex environments into concepts you can understand in minutes rather than hours spent reading multiple documents. Reading a diagram correctly is a skill that separates fast troubleshooters from slow ones.
Reading scope correctly
The first thing to identify in any diagram is its scope. What does it include, and what does it intentionally leave out? Interpreting scope correctly prevents dangerous assumptions. If a diagram shows only the internal LAN, do not assume it documents the WAN connection or the DMZ. Assumptions about undocumented segments cause misconfigurations during changes.
Practical troubleshooting scenarios
Network diagrams serve three primary operational scenarios:
- Cable tracing: Use the physical diagram to follow a cable from an endpoint port to the upstream switch port to the patch panel. This eliminates the need to trace cables manually in a crowded rack room.
- Configuration review: Use the logical diagram to verify that VLAN assignments, subnet boundaries, and routing paths match the intended design. Discrepancies between the diagram and the actual configuration reveal the source of connectivity problems.
- Security audits: Use the logical diagram to identify traffic paths between segments. Auditors and security engineers use these paths to verify that firewall rules block unauthorized lateral movement between VLANs.
When a user reports they cannot reach a specific server, start with the logical diagram. Confirm the user’s subnet, the server’s subnet, and the routing path between them. Then check whether a firewall rule sits between those two segments. That process takes minutes with a current logical diagram. Without one, it takes hours of CLI commands and guesswork.
For physical issues like a dead port or a failed cable, the physical diagram tells you exactly which switch, which port, and which cable run to inspect. Lowvoltagecorp uses this exact workflow when troubleshooting wired network issues for clients across South Florida.
Key takeaways
Mastering network diagram basics requires maintaining both physical and logical diagrams, using standardized symbols consistently, and treating every diagram as a living document updated with every infrastructure change.
| Point | Details |
|---|---|
| Two diagram types | Physical diagrams map hardware; logical diagrams map traffic flow and IP addressing. |
| Standardized symbols | Use recognized icons for routers, switches, and firewalls to prevent misconfiguration. |
| Five-step creation process | Plan scope, inventory devices, select topology, place core devices, then map connections. |
| Line style conventions | Solid lines mean physical connections; dashed lines indicate logical or backup paths. |
| Update discipline | Treat diagrams like blueprints and revise them every time the network changes. |
Why most teams underestimate their own diagrams
I have walked into server rooms where the only network diagram on the wall was printed in 2019 and laminated. Three hardware refreshes later, it was decorative. That is the most common failure I see: teams invest time in creating a diagram once, then treat it as permanent.
The second mistake is building only one type. I have seen shops with detailed physical diagrams and zero logical documentation. When a VLAN misconfiguration takes down a production segment, nobody can trace the traffic path without logging into every switch manually. That costs hours. A current logical diagram cuts that to minutes.
The third issue is symbol inconsistency. When different engineers use different icons for the same device type, the diagram becomes a personal artifact rather than a team resource. Standardization is not bureaucracy. It is the difference between a diagram that helps and one that misleads.
My honest advice: schedule a quarterly diagram review the same way you schedule patch cycles. Assign one person as the diagram owner for each environment. And never deploy a new device without updating the diagram first. The teams I have worked with that follow this discipline resolve incidents faster and make fewer change-related errors. Clear network visuals reduce error rates in maintenance workflows, and that holds true whether you manage a single office or a multi-site property portfolio.
— Aaron
How Lowvoltagecorp supports your network infrastructure
Lowvoltagecorp specializes in wired and wireless network installation, repair, and maintenance across South Florida. Whether you need help documenting an existing network, running structured cabling, or troubleshooting a connectivity issue, the team brings field experience that translates directly into cleaner, more reliable infrastructure.

For property managers and IT professionals who need their network infrastructure documented and maintained correctly, Lowvoltagecorp offers hands-on consulting that covers everything from initial diagram creation to full wired network deployment. The team also handles security camera systems, motorized gates, and cell boosters, so your entire low-voltage infrastructure stays under one accountable service provider. Explore cost-saving security upgrades designed specifically for South Florida owners.
FAQ
What is a network diagram in simple terms?
A network diagram is a visual map showing how devices connect and communicate within a network. It replaces pages of written documentation with a single, readable schematic.
What are the two main types of network diagrams?
The two main types are physical and logical. Physical diagrams show hardware placement and cabling; logical diagrams show IP addressing, VLANs, and traffic flow paths.
What tools are used to create network diagrams?
Microsoft Visio, Lucidchart, and Creately are the most widely used tools. All three offer pre-built symbol libraries and support for both physical and logical diagram formats.
Why do solid and dashed lines matter in a network diagram?
Solid lines represent physical cable connections; dashed lines represent logical or backup paths. Misreading line styles during troubleshooting leads to incorrect assumptions about how traffic actually moves.
How often should network diagrams be updated?
Network diagrams should be updated every time a device is added, removed, or reconfigured. Treating them like living documents rather than static records keeps them accurate and useful during incidents.