A Wi-Fi signal is an electromagnetic radio wave that carries digital data between your device and a router. Your laptop, phone, or smart TV converts binary data into radio waves, transmits them through the air, and your router decodes them on the other end. That exchange happens in milliseconds, constantly, every time you stream, browse, or video call.
The three frequency bands governing modern Wi-Fi are:
- 2.4 GHz: Longer range, better wall penetration, but crowded with interference from Bluetooth, microwaves, and neighboring networks
- 5 GHz: Faster speeds, more available channels, shorter range, and more signal loss through walls
- 6 GHz: Introduced with Wi-Fi 6E and Wi-Fi 7, offers the cleanest spectrum but the shortest practical range
The 802.11 standards published by the IEEE govern how all of this works. Every Wi-Fi device follows these rules to communicate across brands and generations. To share the airwaves without chaos, Wi-Fi uses CSMA/CA, a “listen before you transmit” protocol that prevents devices from talking over each other. Think of it as a conference call where everyone waits for silence before speaking.
Table of Contents
- How Wi-Fi signal strength is measured
- What counts as a good Wi-Fi signal for your situation
- How to check your Wi-Fi signal strength on common devices
- What actually affects your Wi-Fi signal
- Practical ways to improve your Wi-Fi signal
- Why SNR matters more than raw signal strength
- Key Takeaways
- Lowvoltagecorp can help when the signal problem runs deeper
How Wi-Fi signal strength is measured
Signal strength tells you how much radio energy your device is receiving from the router. Two metrics do most of the work: dBm and RSSI.

dBm stands for decibel-milliwatts. It expresses signal power on a logarithmic scale, and the values are always negative in everyday Wi-Fi. Closer to zero is stronger: a reading of -30 dBm is a strong signal, while -90 dBm is barely a whisper. The logarithmic scale trips people up because -45 dBm is significantly stronger than -65 dBm, even though 45 is a smaller number than 65. Think of it as distance below zero: the less distance, the better.
RSSI (Received Signal Strength Indicator) is a related measurement reported by your wireless hardware. The problem is that RSSI is not standardized. One app might show 70%, another shows -63 dBm, and your laptop shows three bars, all for the exact same connection. That inconsistency is why dBm is the more reliable unit for diagnosis.
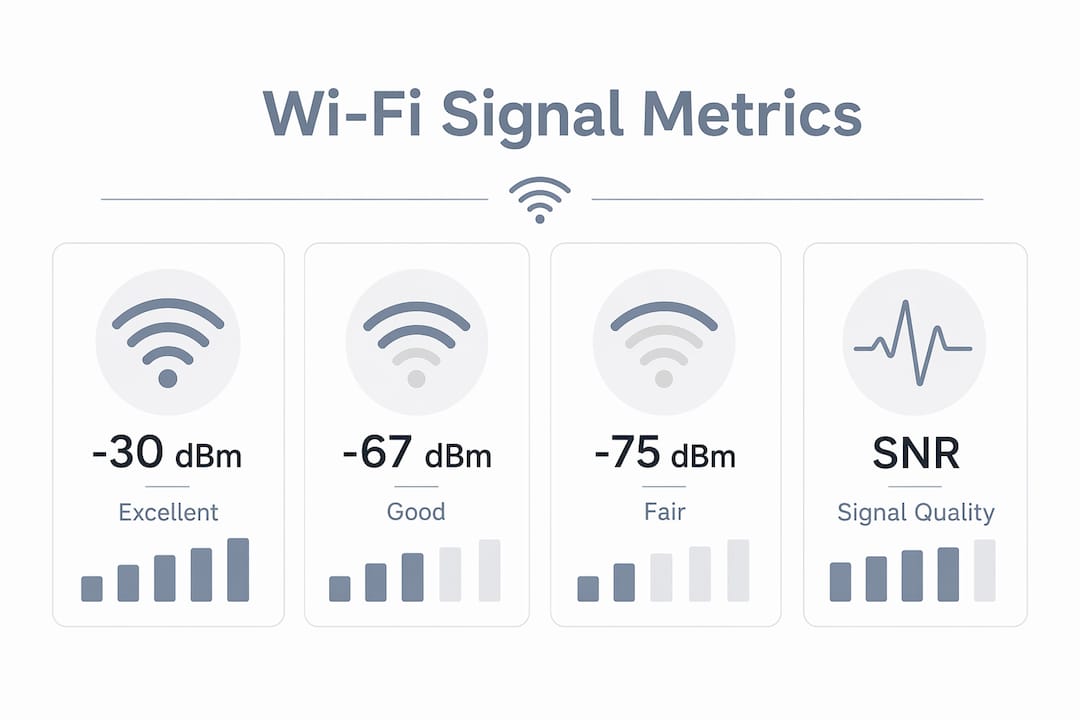
SNR (Signal-to-Noise Ratio) compares your desired signal against background radio noise. It is measured in decibels (dB), and higher is better. An SNR above 25 dB yields reliable performance for voice, video, and real-time applications.
| Signal level (dBm) | Quality label | Practical expectation |
|---|---|---|
| -30 to -67 dBm | Excellent | High-speed work, calls, streaming, gaming |
| -68 to -75 dBm | Good | Reliable for most homes and offices |
| -76 to -80 dBm | Usable to fair | Video calls and normal work, less margin |
| -81 to -89 dBm | Weak | Browsing may work; calls and high speeds suffer |
| -90 dBm or lower | Poor | Dropouts, low speeds, and retries likely |
Common tools for measuring these values include Wi-Fi Analyzer (available on the Microsoft Store) on Windows, the airport -I command on macOS, and various Android apps that display live dBm readings. These give you real numbers instead of the vague bar icons your device defaults to.
What counts as a good Wi-Fi signal for your situation
The right signal threshold depends on what you are doing. Not every activity needs the same quality floor.
- A very strong signal is excellent for any application.
- Good signal strength supports streaming, calls, and gaming reliably.
- Usable signal allows video calls and normal work, though with less margin.
- Weak signal may support browsing but struggles with consistent throughput applications.
- Poor signal causes frequent disconnections and low speeds.
Signal bars on your phone or laptop are a manufacturer-specific abstraction. Bars do not show channel congestion, noise levels, or router load. A device can display full bars and still feel sluggish if the channel is saturated. Another device showing two bars can stream smoothly if the signal is clean and the SNR is healthy. Never use bars alone to diagnose a Wi-Fi problem.
One more thing worth knowing: signal strength and internet speed are not the same thing. A strong signal gives the connection room to use faster modulation, but it cannot fix an overloaded router, a congested ISP, or a saturated upload line.
How to check your Wi-Fi signal strength on common devices
Getting past the bar icons requires a few extra steps, but the payoff is a real number you can act on.
Windows:
- Open Command Prompt or PowerShell
- Type
netsh wlan show interfacesand press Enter - Look for the “Signal” percentage and “RSSI” value in the output
macOS:
- Hold the Option key and click the Wi-Fi icon in the menu bar
- The dropdown shows RSSI and noise floor directly
- Alternatively, run
airport -Iin Terminal for a full readout including SNR
Android:
- Go to Settings, then Wi-Fi, then tap your connected network
- Some Android versions show signal strength in dBm under “Advanced” or “Network details”
- Third-party apps like Wi-Fi Analyzer display live dBm and channel information
iOS:
- iOS does not expose dBm natively in settings
- Field Test Mode (dial
*3001#12345#*) shows raw signal data, though this is primarily designed for cellular - Third-party apps from the App Store provide Wi-Fi signal readings in dBm
A few practical tips for interpreting what you see:
- Walk the rooms you care about and note where readings drop below -67 dBm
- Check SNR alongside RSSI. A reading of -65 dBm with an SNR of 30 dB is more usable than -55 dBm with an SNR of 12 dB
- Run readings at different times of day. A congested apartment building will show worse SNR in the evening when neighbors are all streaming
Pro Tip: On Windows, netsh wlan show interfaces also displays the current band (2.4 GHz or 5 GHz). If you are stuck on 2.4 GHz when 5 GHz is available, that single switch can dramatically improve throughput.
What actually affects your Wi-Fi signal
Physical and technical variables both play a role, and the physical ones tend to hit harder than most people expect.
Physical obstructions are usually the largest practical limitation. Thick walls and metal shelving can reduce signal drastically. Two concrete walls can cause significant signal loss, reducing signal strength to a small fraction of its original level. Metal studs, rebar in concrete, low-e window coatings, and even large aquariums all absorb or reflect radio waves. Understanding signal attenuation helps you predict where dead zones will form before you even move furniture.

Distance compounds the problem. Doubling your distance from the router costs approximately 6 dB of signal. That 6 dB rule works in reverse too: each 6 dB gain in signal strength doubles your effective coverage distance, which is why router placement decisions carry so much weight.
Frequency band behavior shapes range and speed simultaneously:
- 2.4 GHz travels farther and penetrates walls better, but it shares spectrum with microwaves, Bluetooth devices, baby monitors, and every neighbor’s older router
- 5 GHz suffers more path loss through walls than 2.4 GHz, roughly 7 dB more at the same distance, but offers cleaner channels and higher throughput
- 6 GHz delivers the fastest speeds in clean spectrum but has the shortest practical range through building materials
Interference sources include microwave ovens, cordless phones, and other wireless devices operating in the same frequency range. In a dense apartment building, dozens of overlapping networks on the same channel create noise that degrades SNR even when raw signal strength looks fine. In the 2.4 GHz band, channels 1, 6, and 11 are the typical non-overlapping channels used in North America. Using other channels can lead to shared spectrum and potential interference with neighbors.
Wi-Fi standards set the ceiling for what your hardware can achieve. 802.11ac and 802.11ax (Wi-Fi 6) deliver meaningfully better performance than older standards, with Wi-Fi 6 supporting up to 9.2 Gbps across multiple streams and handling dense device environments more efficiently through technologies like OFDMA and MU-MIMO.
Connected device count matters because Wi-Fi is a shared medium. Every device on a channel competes for airtime using CSMA/CA. Add enough devices and the overhead of listening, waiting, and backing off consumes more airtime than actual data transmission.
Pro Tip: If your router supports both 2.4 GHz and 5 GHz under the same network name (band steering), your device may not always pick the better band. Splitting them into two separate SSIDs gives you manual control over which band each device uses.
Practical ways to improve your Wi-Fi signal
Most Wi-Fi problems are solvable without buying new hardware. Start with placement.
Router location is the easiest fix and the most overlooked one. A router tucked in a cabinet, sitting on the floor, or shoved in a corner covers your neighbor better than your own living room. Place it centrally, elevated, and in the open. That single change redistributes signal to every device simultaneously. For deeper guidance on network performance optimization, the principles that apply to enterprise setups translate directly to home environments.
Beyond placement, these steps address the most common signal problems:
- Change your Wi-Fi channel. Use a Wi-Fi analyzer app to scan nearby networks and pick the least congested channel. On 2.4 GHz, stick to channels 1, 6, or 11.
- Use the 5 GHz band for close-range devices. Phones and laptops within the same room as the router will almost always perform better on 5 GHz.
- Update router firmware. Manufacturers release firmware updates that fix bugs, patch security vulnerabilities, and sometimes improve radio performance. Check your router’s admin panel monthly.
- Use mesh networking for large spaces. A single router rarely covers a multi-story home well. Mesh systems place multiple access points throughout the space, but only work well when nodes maintain a strong backhaul connection to the main router. Place mesh nodes where they can still hear the main unit clearly, not in the dead zones you are trying to fix.
- Wire stationary devices. Desktop computers, smart TVs, and gaming consoles do not need to be wireless. A wired Ethernet connection eliminates signal variability entirely for those devices and frees up wireless airtime for everything else. The benefits of wired connections go beyond speed: latency drops and reliability improves.
- Enable QoS (Quality of Service). Most modern routers let you prioritize bandwidth for specific devices or applications. Video calls and gaming benefit most from this setting when the network is under load.
- Reduce co-channel interference. If you manage multiple access points, assign them non-overlapping channels so they do not compete with each other.
For broader network planning, especially across multi-unit properties, wireless network management involves channel planning, access point density, and backhaul design that go well beyond a single router swap.
Why SNR matters more than raw signal strength
Signal-to-Noise Ratio is the metric that most accurately predicts real-world Wi-Fi performance, yet most people have never looked at it.
Raw RSSI tells you how loud the router sounds at your device. SNR tells you how clearly you can hear it above the background noise. A clean -67 dBm signal in a quiet environment can outperform a -50 dBm signal in a room full of interference, because the noisier environment forces the connection to use slower, more error-resistant modulation.
The practical benchmarks:
- SNR above 40 dB: Excellent. Maximum throughput, stable roaming, no retransmissions.
- SNR 25–40 dB: Good. Reliable for voice, video, and demanding applications.
- SNR 15–25 dB: Fair. Data transfer works, but real-time applications may struggle.
- SNR below 15 dB: Unreliable. Expect retransmissions, dropped packets, and poor throughput regardless of how strong the raw signal appears.
Network professionals focus on SNR rather than RSSI because a moderate signal in clean spectrum outperforms a strong signal battling heavy interference. The noise floor in a clean environment sits around -90 dBm. In a noisy apartment building, it can rise to -85 dBm or higher, compressing the usable SNR even when your RSSI looks acceptable.
Device signal bars are a manufacturer-specific abstraction that partially correlates with connection quality. They do not reflect noise, channel congestion, or retransmission rates. When you are troubleshooting a slow connection that shows full bars, SNR is the first number to check.
Key Takeaways
Wi-Fi signal quality depends on SNR, frequency band, placement, and standards support, not just the bar count your device displays.
| Point | Details |
|---|---|
| dBm is the reliable unit | Aim for -67 dBm or better in important rooms; below -75 dBm causes dropouts and retries. |
| SNR beats raw signal | An SNR above 25 dB predicts reliable performance better than RSSI alone. |
| Placement is the first fix | A central, elevated, open router position improves coverage for every device at once. |
| Band choice shapes range and speed | 5 GHz delivers faster speeds; 2.4 GHz reaches farther but carries more interference. |
| Wired beats wireless for stationary devices | Ethernet eliminates signal variability and frees wireless airtime for mobile devices. |
Lowvoltagecorp can help when the signal problem runs deeper
Some Wi-Fi problems go beyond router placement and channel selection. Structural interference from concrete, metal conduit, or building layout requires a professional site survey and proper access point placement. Lowvoltagecorp specializes in wired and wireless network installation, repair, and maintenance for residential and commercial properties, including full wireless network setup designed around your actual floor plan and usage needs.
If your property also runs security cameras, motorized gates, or cell boosters, Lowvoltagecorp handles all of it under one roof. Reliable connectivity is the foundation every other system depends on.